Menu

While there’s no doubt that Google Data Studio is a fantastic tool to present an overview of information and important metrics, the way you organise that data will have an impact on how effective that presentation actually is. As a professional, you might not have any problems quickly identifying the data that’s important to you, but for others a sudden wall of charts and numbers may seem overwhelming or unintuitive.
Like most things, Data Studio is only as good as you make it. Creating a dashboard that considers user experience and intuitive navigation can make it much easier for your audience to understand that data and the story you’re trying to tell. If you get it just right, your client can only appreciate your value as a service provider that much more.
To help you make your dashboards as easy and intuitive as possible, we’ve put together this list of simple tips that you may have overlooked in the past.

An intuitive dashboard is a good dashboard
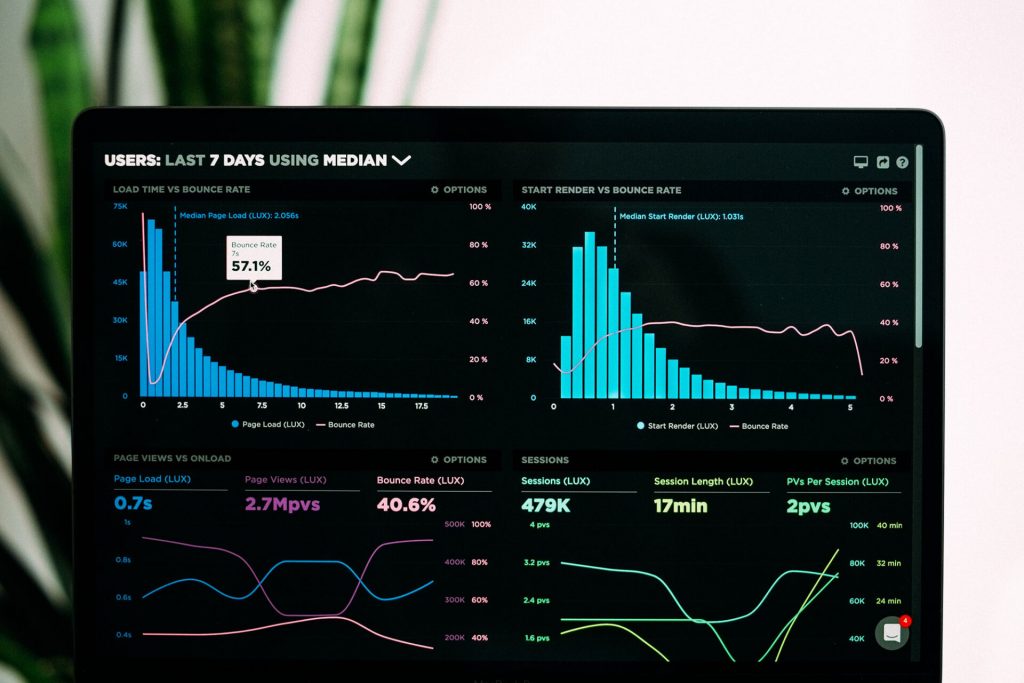
Most people looking at your dashboard are probably wanting to get a topline look at the most important details ‘at a glance’. Position your key observations and main points in a prominent area of the first user touchpoint, taking into account the typical ‘Z’ pattern of reading that we all employ. The most important things to think about here are the customer KPIs, and the overall point you want to make, so make sure that everything is right there up front.
It’s human nature for us all to interpret things as simply as possible, as this takes the least effort. The moment we face something that looks complicated we are subconsciously resistant to understanding it in the right way. The same thing goes for data dashboards – Your audience’s interpretation of what they see versus what you want them to understand all depends on how things are presented.
Interpretations can be simple. For instance, if you want to make a trend look good or bad, you’ll be using red or green colours to indicate how positive or negative the data is. Similarly, including icons wherever possible goes a long way, such as an icon of a mobile phone to indicate mobile data.

Neat, colourful and clearly labelled
Another key aspect of good UX is to cater for the way we perceive objects as organized patterns. In other words, grouping items that are connected by theme or visual attributes. For Google Data Studio, there the three main ways you can group information for easier understanding:
Similarity – By using a well thought-out colourset and visual hierarchy, users will quickly be able to understand a wider theme in just a few seconds, helping them to digest the data and make links in their mind.
Regionality- Enclose relevant information within visual boundaries, such as colours, shapes, borders and background tiles.
Proximity – By placing related information sets closer to each other, the overall story can be interpreted more easily. For example, these could be data points that relate to a core KPI in the form of graphs and tables.

Consistent visual, clear grouping
Google Data Studio is a fantastic way to display data, and while you’ll want to your report as attractive and unique as possible, this might end up being to the detriment of the overall delivery. Your clients are likely to be using other dashboards or interfaces and are therefore expecting your reports to have some visual consistency with those.
Generally, these are the things you’ll want to do to create that familiarity:
The good news is that you can take advantage of professionally-made templates that are still visually distinctive, but without taking the toll on user understanding. Here are some great examples.
All effective narratives have a beginning, middle and an end – so your report should be no different. When putting together a report, you want your end-user to come away with more than a bunch of numbers and graphs. You want them to understand what they’re seeing so that they can take action, or present the findings to their own internal teams.
Data Studio has a really useful drag and drop function which might tempt you to pepper a page with everything you have. We recommend that you actually spread out your report across a few pages (clearly signposted) that are split into different topics such as demographics, KPIs, sectors and so on.

A table or list of contents is always a good idea
Odds are that your clients will try scrolling once opening the report, so create a nice narrative path through the data. Don’t forget to create a contents page by choosing ‘left’ in the navigation position option in the Layout/theme sidebar. You can even create some kind of visual indication of their progress through the report, such as a progression bar or line.
To tell the best story possible, you’ll benefit from understanding exactly how users interact with the pages within the report. To do this, go ahead and install the Google Analytics tracker on your studio report by selecting file → Report settings. Copy in your tracking ID and then you’ll be good to go.
After implementing Google Analytics we recommend looking at the ‘behaviour’ section of the report, and the ‘content’ section within. Choose ‘page title’ and you’ll be shown useful information such as page views, bounche rates, time spent on page and other data.
Everyone has different perspectives and levels of expertise, so when you’re putting your report together, make some effort to tailor it towards the audience. For instance, if they are more senior and less technical, they aren’t likely to have too much patience when trying to understand what they are looking for. They are probably going to want the bottom line quite quickly, so try to stay as concise as possible.
Conversely, if your report-receiver is a data analyst or technically-minded, you don’t want your report to be too simplistic. There’s no harm in having plenty of detail in place for those who want it; as long as the flow and arrangement makes sense.

Sometimes, all people want is everything at a glance.
With the above tips and a little common sense, your Data Studio reports stand a much better chance of achieving their goals. By using them in any combination you see fit, reports will be less cluttered, more intuitive and more engaging.
There’s one simple way to know exactly what your customer wants to see in their reports: Just ask them! There’s nothing wrong with finding out their personal preferences, and which areas they want to focus on. They might not be bothered by bells and whistles, instead preferring to get straight to the numbers. Or, they might want it dressed up a little bit so that they can present it to their superiors.
Whether you’re a newbie or industry veteran, you can make your life easier by using a template that’s already made. Ready-made templates often employ many of the UX considerations mentioned in this article and have been created by experts who know everything there is to know about reporting best practice.
Go ahead and take a look at our templates catalogue and find the one that suits your needs the most.