Menu


Facebook Ads are one of the most commonly used and most important paid marketing channels. Facebook ads level the playing field, allowing small businesses and enterprises to compete for customers on Facebook, Instagram, and the rest of Facebook’s ecosystem.
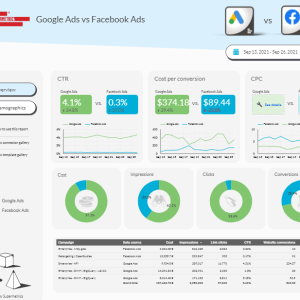
If you’ve looked at a report in Facebook, you know they have a fairly robust reporting platform. So where does Google Data Studio come into play? Two reasons. First, Data Studio excels at pulling in metrics from multiple platforms. If you want to see your Facebook Ad data along side Google Ads, Analytics, Ecommerce, or other marketing data, Data Studio is indispensable. Second, impressive as Facebook’s native reporting can be, Data Studio has it beat for visualizations.
Some companies like Supermetrics and Power My Analytics offer specific Data Studio Connectors to Facebook. Here is our step by step guide on on connecting to facebook ads to Looker Studio using Supermetrics. While these options are convenient, these can get expensive. In this article, we’ll take you through the steps of connecting for free, pulling data out of Facebook, putting it into a Google sheet, and finally connecting it to Data Studio. The Facebook data we’ll pull is the standard ad report (with a few modifications). If you need a quick Data Studio report or want a ready-made template, the data will work perfectly with this template available in our gallery.
If you have a business account, go to https://business.facebook.com/ and click “Ads Manager”. Or, if you don’t have a business account set up, go to https://www.facebook.com/adsmanager/
Either way you want to end up on a screen that looks like this.
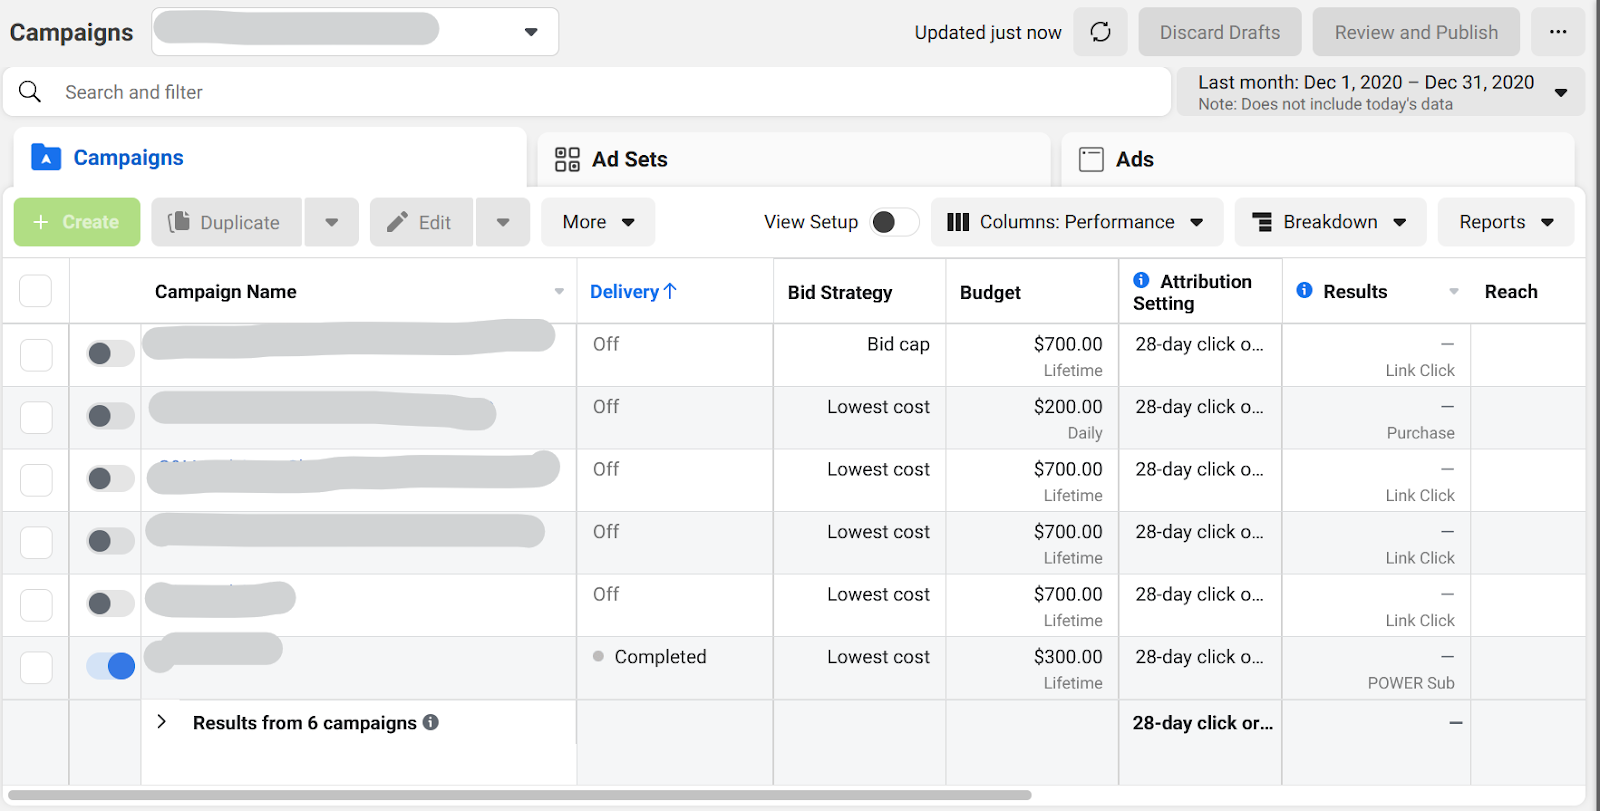
Establish the date range you want to investigate. We recommend a one month period, though you can do longer. The way we’ll analyze the report later, we’ll use day-by-day metrics. If you do a longer period of time, you may want to look at analyzing week-by-week instead.
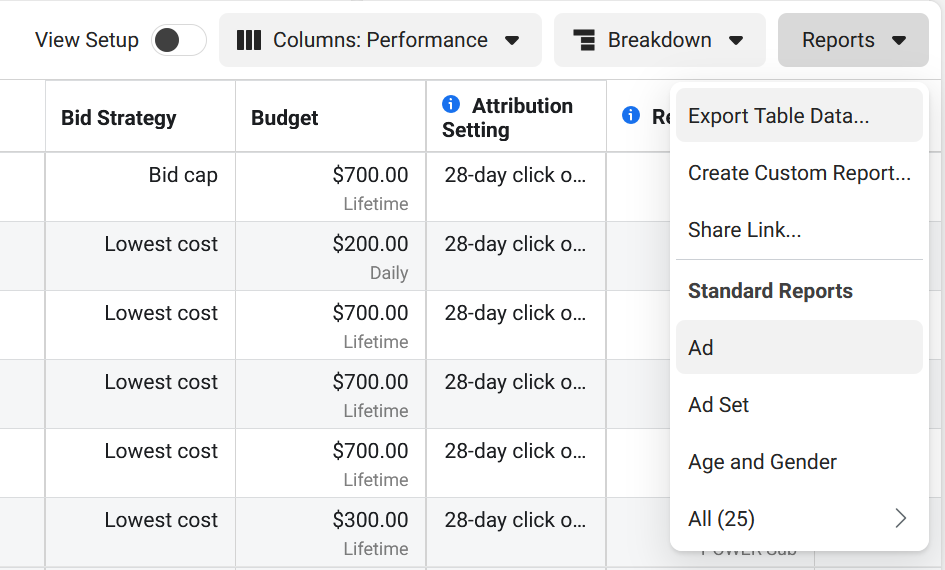
With the date range set, you can select a report. Click the reports drop down and select “Ad” under “Standard Reports.”
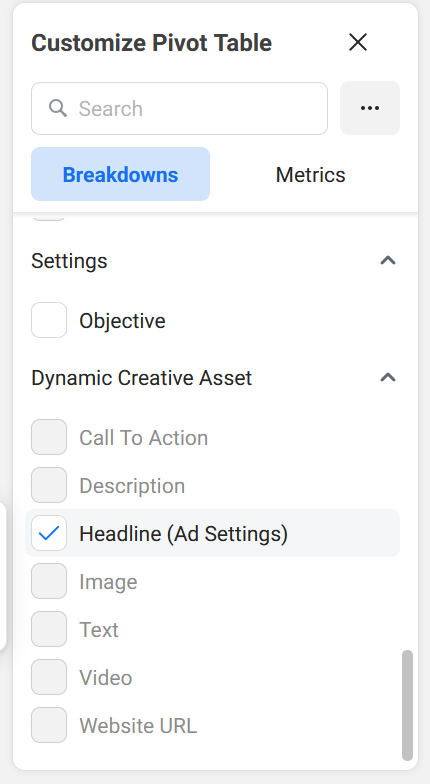
This report comes with most of the data we want, but adding a few metrics will make the data even more useful. Before you start, make sure you’re still working within the correct date range. Sometimes Facebook can reset the filter when you open a report. Using the “Customize Pivot Table” options on the right, we’re going to add a few breakdowns, which will act as dimensions in our Data Studio report, as well as a few new metrics.
Under “Breakdowns” add:
And add the following under “Metrics”
Click the export icon from the top menu and export as raw data in an xlsx format, which is the default option. Be sure to save the Facebook report so you can return to it again next month.
Now, we want to load it into Google Sheets. Either copy and paste the whole sheet into a blank Google Sheet, or upload the excel file to Google Drive and convert it to a Google Sheet.


If you’re doing the upload option, open Google Drive and Click on New > File Upload Select the file and click on Open. Once the upload finishes, click on the file name. Click on Open with Google Sheets button at the top.
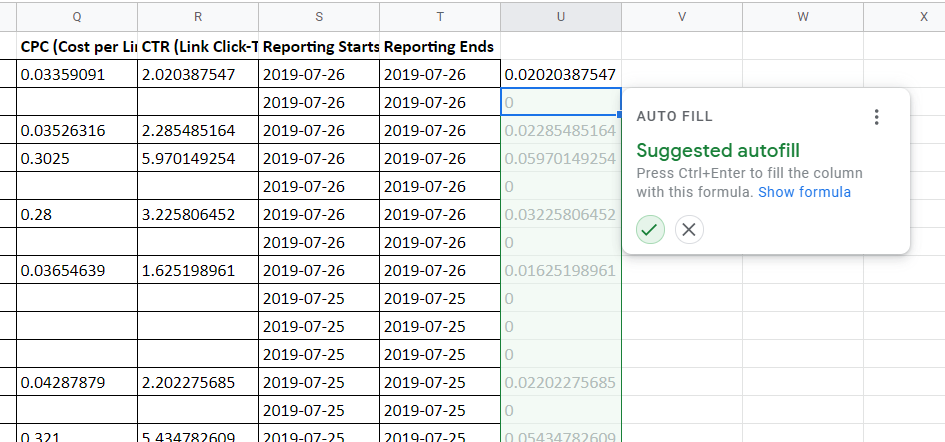
Before we pull the data into Data Studio, we need to convert CTR metric into a percent. In cell 2 of a new column, type in this formula “=U2/100.” CTR happens to be in column U in our sample sheet, though you should use whatever column it appears in your spreadsheet. Then, either use autofill or copy and paste that cell down to all the rows in that column.
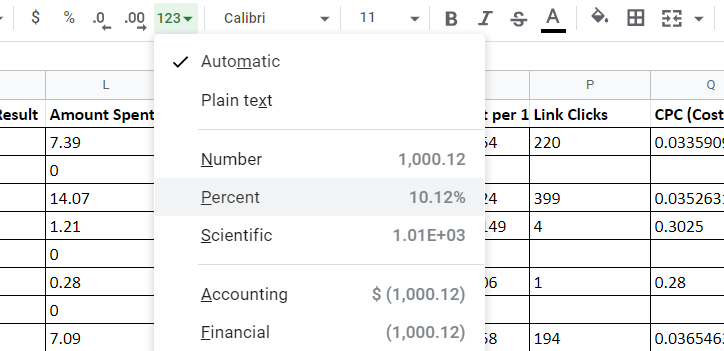
Highlight the whole column and cut and paste only the values (ctrl+shift+v on Windows) over the existing data in R2. Finally, convert all those values to a percent by changing the type in the top menu.
Be sure your Google Sheet has a name before you continue!
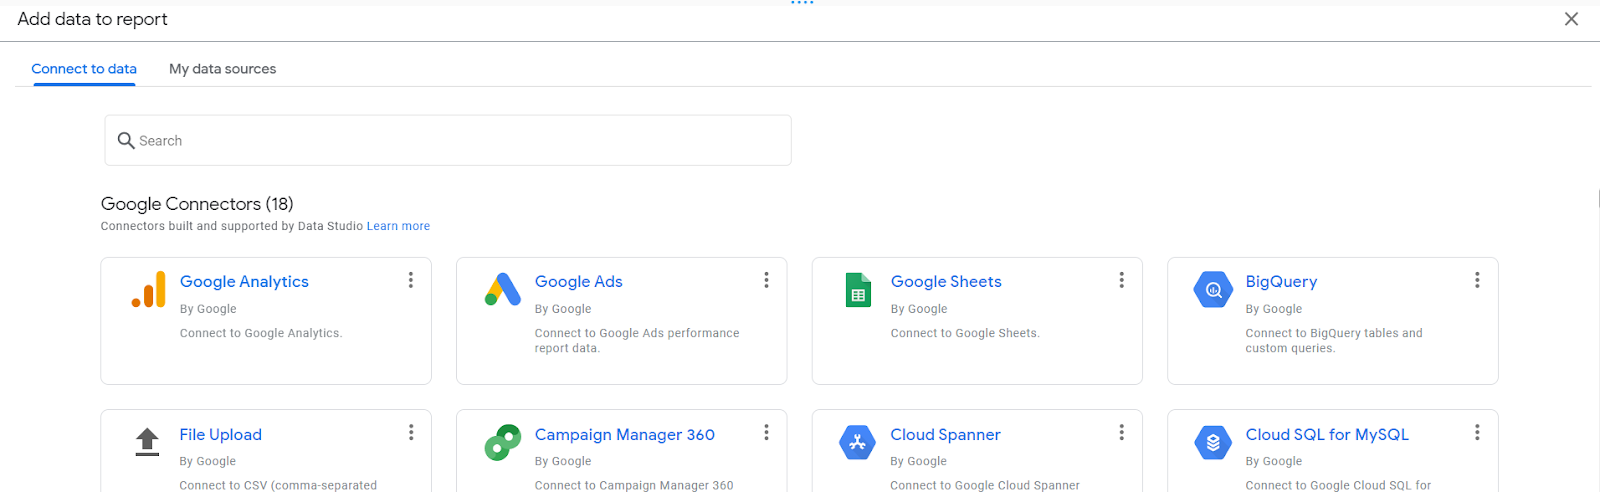
Open a new blank Data Studio Canvas and for your data connector, select Google Sheets. Then, choose your spreadsheet from the list (it should be on top).
The final step before plugging your data into a dashboard is to change some of the metrics. This is especially important if you’re using the Facebook Ad Template. Click the pencil next to the report name in the right sidebar data editor.
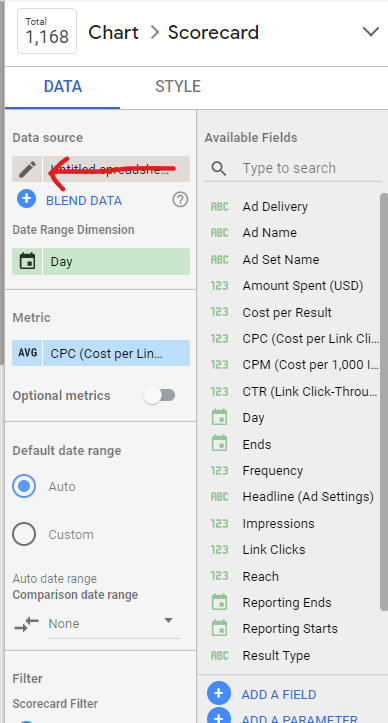
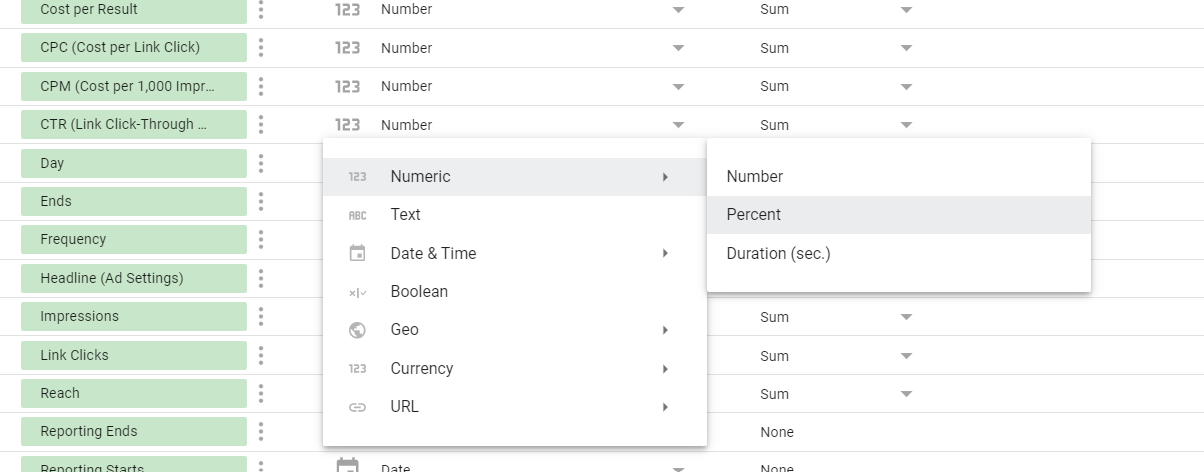
Once you have that open, you can change the type and default aggregation in the drop down menus next to each metric and dimension.
Here’s a quick guide:
CTR – Change the type to Percent
CPM, CPC, CTR – Change the Aggregation to Average
CPM, CPC, Amount Spent – Change the Type to Currency
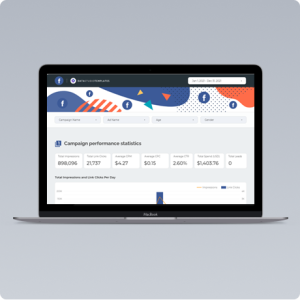
You’re now ready to use the metrics and dimensions in Data Studio’s charts, tables, and scorecards. Particularly helpful are views that allow you to see impressions, clicks, and spend side by side to optimize your campaigns.
Facebook has many more data points than the ones we’ve used in this example. If you’re looking for something specific, go back to the report editor, find your metric in the “Customize Pivot Table” sidebar, and report the steps to export, upload to Google Sheets, and connect to Data Studio.
If you are looking for ready made Facebook Ads templates, here are some of our top sellers: