Menu


This article was written to accompany the ‘Marketing Funnel with Google Analytics Dashboard’. It can be used as a walkthrough to setup the dashboard
Target audience: Online Marketing, Controllers, Chief Marketing Officers (CMOs)
Reading time: 10 min.
Difficulty Score: 6 of 10
In today’s complex digital economy with a variety of tools to attract an audience, it’s critical for companies to have constant visibility into the investments they make. Are you acquiring the right audience and enough of that audience? Which channels are performing best? Are you hitting your business goals and sales targets? These are some of the questions businesses need to ask themselves and need tools in place to answer them.
One effective way to keep constant visibility into your lead/buyer potential and your costs is through the use of marketing funnels. A marketing funnel is a crucial tool for CMOs, online marketers, and controllers to understand where customers are coming from and where they are in the pipeline.
Building a marketing funnel in Google Data Studio allows you to combine online marketing sources via the supermetrics connector and create a centralised, comprehensive, and interactive data solution. There are just two things that you’ll need to set up your marketing funnel: a website that is tracked by Google Analytics (together with goals and events) and Google Data Studio (connected to your Analytics account). If you need a refresher on how to connect a data source, check out this article.
Before we dive deeper into why you need a funnel and how to make one, let’s clear up the difference between a marketing funnel and a sales funnel. Note that these will look different for every company depending on the kind of product they sell.. Take, for example, an ecommerce company with an online store selling directly to consumers. In your marketing funnel, customers become aware of your site/brand, interact with your site by searching through products or reading a blog, and then make a purchase, or perhaps give you their email for a coupon. They may not complete every step, but most will. In this case, the marketing and sales funnels can be combined into one.
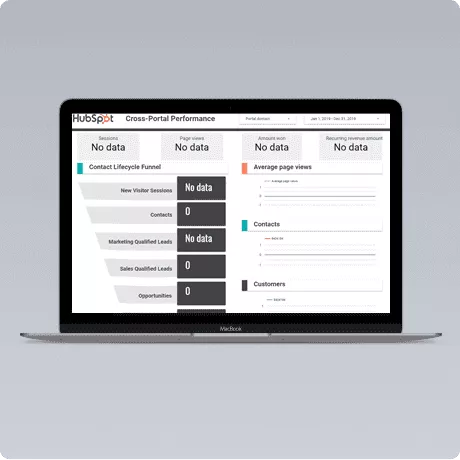
The Data Studio Dashboard above is an example of a combined marketing and sales funnel.
Now imagine an enterprise software company. The product is expensive, not something customers can just ship to theirhouse, and takes months to complete a sale. In this instance, the funnels are separate. The marketing funnel starts with awareness, engagement and then results in a lead. Once they are a marketing qualified lead, they pass over to the sales funnel where they go through new stages like being contacted, setting up meetings, evaluating fit, and finalizing a sale.
Whether you need two funnels or one, you’ll benefit from tracking efforts from the initial marketing interaction through the sale. These funnels will show you where customers are dropping off or getting hung up, how to optimize your process, and what channels are bringing you the most success. To keep things simple, in our example funnel in this article, we’ll think of just one funnel that combines both marketing and sales.
Before moving further, let’s take a look at the steps that go into a typical marketing funnel:
| Funnel Stage | Explanation |
|---|---|
| Awareness | The very first stage consists of a few metrics like the number of click throughs (minus bounces) from paid campaigns, social media, organic search, and other channles to show the total page visitors to the website. Let’s consider this number of people as ‘100%’. |
| Engagement | Here, we pre-qualify our site visitors by letting them actively interact with the website, such as clicking a CTA button. By filtering for interested site visitors, our number of users is reduced to about 20-30%. |
| Lead | In order to differentiate visitors who are ‘ready to buy’ from the others, we can attempt to obtain data (such as names, email addresses etc) from them, which will then allow us to process them in a targeted manner via email or other means. By now, our visitors are just 10-15% of the original number from the top of the funnel. |
| Sell | This is the final stage of the funnel, where actual sales or conversions are made. Broadly (and if marketing teams have been effective), this would be around 5% of your original site visitors. |
Based on these broad steps it gets easier to imagine your own marketing funnel to measure which areas you need to improve on, and which ones are performing well. You can even implement different cost-per-acquisition elements for the different levels to operate with your Google Ads more efficiently.
Or, if you’re just starting a new business, your marketing funnel can show you how much a sale will cost you in terms of advertising spend. By using this information you’ll be able to fine-tune your pricing to find that sweet spot between customer value and your own profit.
Building a good marketing funnel takes a lot of time and requires advanced knowledge of Google Analytics. Most businesses don’t have the resources to build a robust report themselves, so they instead opt to use a template which has all of the functionality they already need. Templates are popular for businesses of all sizes and are the preferred cost-effective way to obtain and use marketing funnels.
For convenience we have already created a template for a marketing funnel you can use to quickly plug in your own data and start analyzing right away. The rest of this article will walk through the creation of your own basic funnel step-by-step.

Step 1: Choose the right dimensions and metrics
In general, there are no restrictions as to which dimensions and metrics you include in the report. It’s up to you to decide which expose the most useful data for you to analyze your marketing funnel. We’ve created a few suggestions mapped next to the different funnel stages below.
| Funnel Stage | Explanation |
|---|---|
| Awareness | Here, we are mainly interested in the number of unique page visitors, first-time visitors, acquisition channel, and the bounce rate. |
| Engagement | You can insert the users of the selected interaction here. The dwell time, bounce rate and time distribution of clicks on your CTA throughout the day can be very useful for later interpretation. |
| Leads | In addition to the number of leads, you can also list their interests and interpret the information that Google Analytics provides, which will be valuable to your sales and marketing teams. |
| Sell | Sales and revenue are likely to be one of your most important KPIs, so including them in your marketing funnel will help put all the data into perspective. |
Once you’ve clarified what you want to observe in terms of KPIs, then it’s time for the graphical design.
Step 2: Pick the right charts
After you’ve picked the metrics and dimensions for your funnel, you need to choose how to display them on the dashboard. There are a number of charts available for your use, each visualizing the data in just a slightly different way. This guide walks through the different charts and some important use cases for each.
Once you’ve selected the chart from the toolbar, click to drop it into the report. Once it’s on the page, you can then use the data editor to select the metric or dimension and further alter the way the data is displayed with the style editor.
Step 3: Create filters for each funnel stage
If you’re using the same metric throughout the funnel, for instance, users, you need to filter the data at each step of the funnel to only consider select data.
Achieving this depends on your way of tracking in Google Analytics. The most common approach is to analyze the customer journey to identify which event is a unique identifier for the specific marketing funnel stages.
A normal customer journey might look like this:
Example:
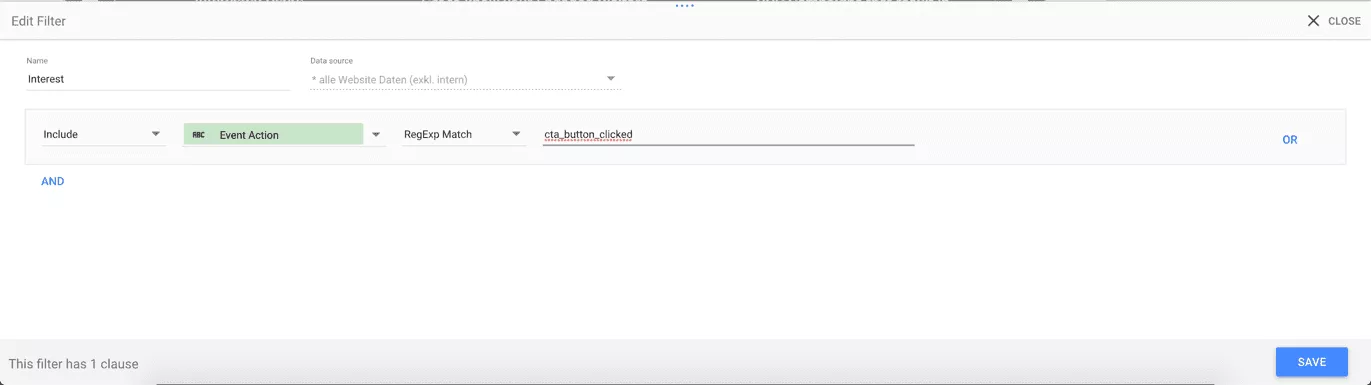
In each case, we’re using the user metric, but we’re filtering by specific actions they’ve taken. This is a very basic scenario. For more information on how to use filters with more complicated settings in Google Data Studio, check out this article.
Step 4: Visually create a funnel
Now that you have the data for each chart, you need to organize it into a funnel. Here’s where you can use Data Studio’s images, shapes, and lines to create the visualization. This can be accomplished a few ways. For example, in this funnel, the design uses lines and shrinks the funnel into four steps using text boxes to highlight each new stage. This funnel, on the other hand, uses a background image of a funnel and drops in scorecard metrics on top. Finally, another approach involves a more creative vertical display that’s heavy on visuals to simulate the user journey.
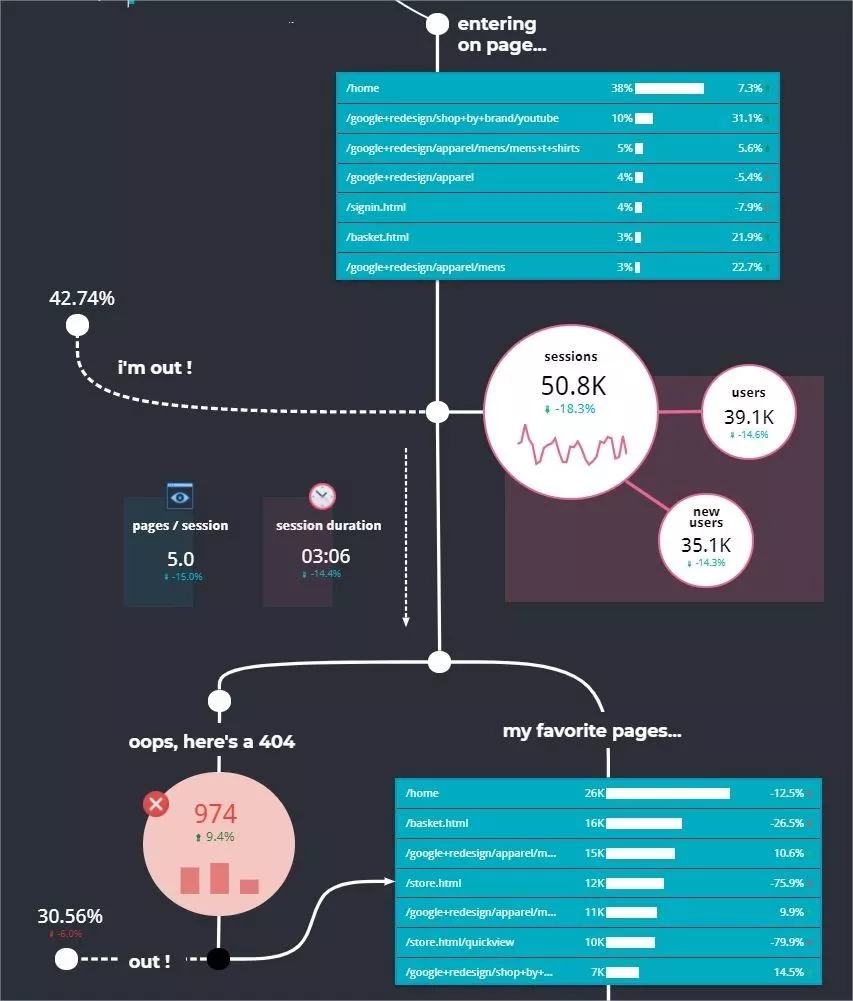
This marketing funnel looks like a path, a unique twist on the traditional funnel.
Step 5: Utilize Your Funnel
You’re done! Now it’s time to gather the data and implement the key learnings you’ll make along the way. Data Studio makes it easy to refer back to your dashboard regularly. You can share it as a link to share with teammates and managers or embed it in an iframe somewhere on an internal site. You can also schedule regular email deliveries of the report as a PDF. Add a date filter or a include historical data on the chart to help you track metrics across different time periods.
If you prefer to use one of our premium marketing funnel templates, the below video will show you how to do it in mere minutes. Just copy the pre-made marketing funnel data studio template into your environment, adapt your filters to your specific events and you’re done!
There’s quite a lot to digest in this article, so here’s a quick recap in just a few bullet points: