Menu


Google Data Studio has powerful features which make it a compelling alternative to other established platforms. In a recent article we compared these differences and made a case for GDS. GDS has come out with a slew of new updates over the past months which has made it even better
In this post, we’ll talk about some of the most noteworthy updates to the platform, plus our thoughts on each one of them. Here’s an overview of the best and the latest on GDS that we’ll cover:
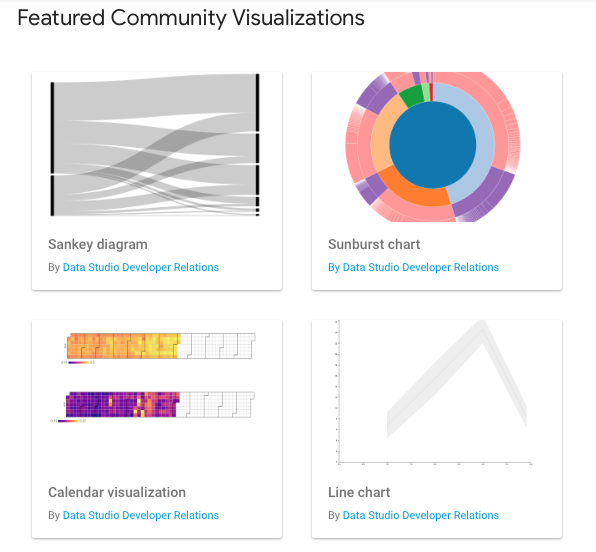
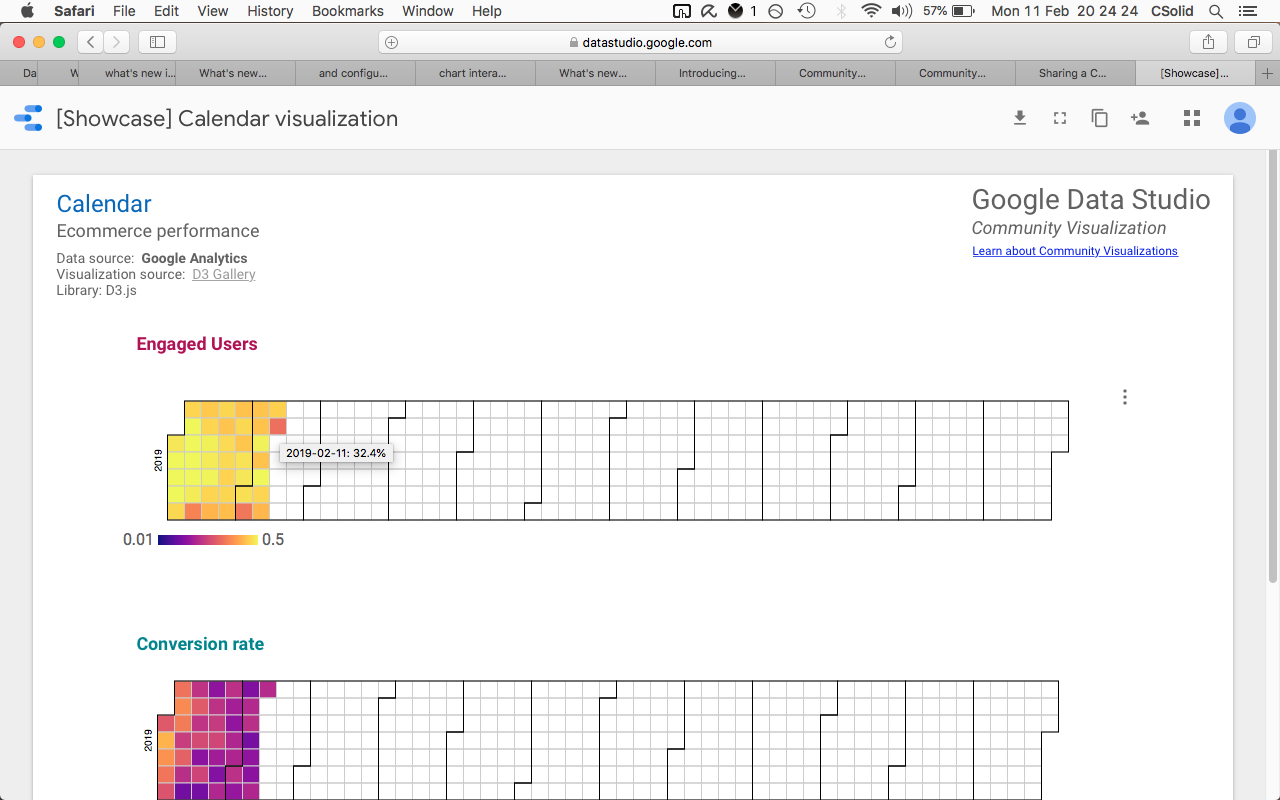
GDS already offers a vast range of templates you can use to visualise your data. However, this usually isn’t enough if there’s a specific way you wish to display your data.
With the Data Studio Community Visualizations Developer Preview, you can build charts and style them so you can present your data that’s easy to understand and blends seamlessly with your dashboard’s design.
Developers now have a wide range of tools to build, use, and share community visualisations, including the Data Studio Community Component Library. Plus, there’s more you can do with Data Studio Community Visualisations, like:
This Developer Preview version means it’s still constantly being improved. But you can also develop and share your own visualisations already if you wish. Either way, everyone’s welcome to provide their feedback to the GDS team so they can further improve this feature.
The wealth of GDS templates is a great way of helping you set up your dashboard quickly. But when it comes to telling rich stories with data, you might need to customise your dashboard a bit more. With Data Studio Community Visualisations Developer Preview, you can tell these stories your way with an extra layer of customisation. A few features may still be lacking here and there since it’s a Developer Preview, but like Google’s other products, you can be sure that it will only get better.
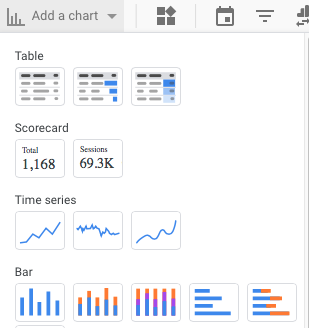
While you can now customise your charts, there are still, of course, the good old pre-built ones, so you can create dashboards easily. The great thing is that the GDS team made it even easier for you to create visually striking charts:
You can customise your chart further, of course, without being technical. While components ‘snap to grid’ by default, you can position them exactly the way you want using your mouse and keyboard. Another thing is that you can switch chart types using the chart icons, so you can quickly decide which type of chart is best suited for your dashboard. What’s more is that whatever customisations you made to the previously selected chart will remain intact, saving you a lot of time in the process.
That’s not all. Adding and replacing fields in a chart takes just a few mouse clicks. You can also add other components like interactive components, images, and annotations, to make your dashboards richer and easier to understand than ever before.
Most recently, the GDS team also let users customise the axis and data labels of bar, line, scatter, and area charts. As usual, you can access this in the STYLE if you’re using the appropriate chart type.
People can be neatly divided based on how they prefer to create their dashboard. One camp wants it to be as simple as possible so that they can share their dashboard as quickly as possible. The other, meanwhile, wants a greater level of control so they can create dashboards that match their exact specifications. For those who want simplicity, GDS’ three-step chart creation can be a huge benefit. All in all, it’s about giving even non-techies a great way to create and share dashboards.
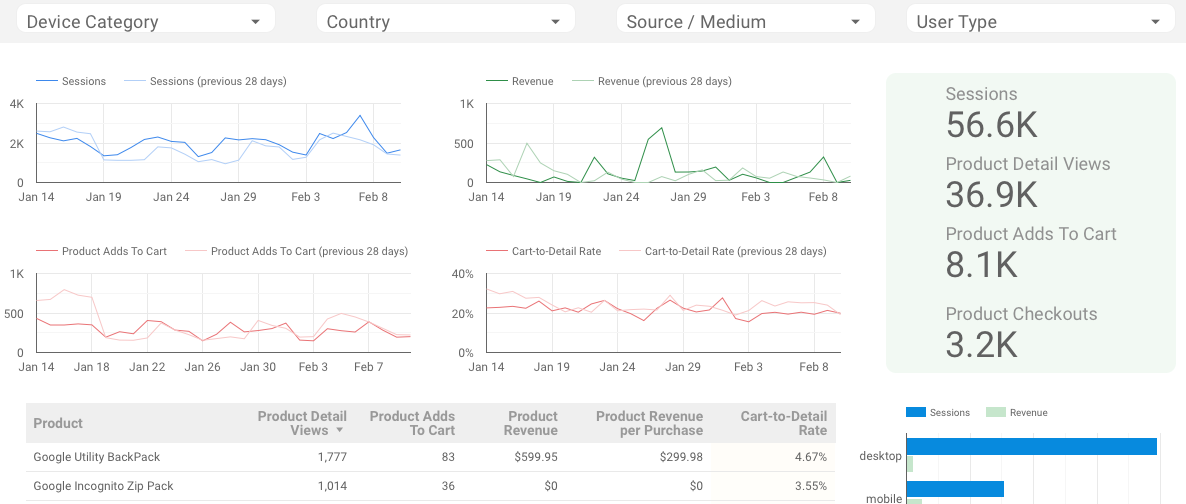
Why stop at great looking charts when you can add a level of interactivity to them? In its latest update, GDS also added what is called interaction filters. They work like filter controls, so when you click on a portion of the pie chart, for example, you’ll be able to filter results based on your selection. Or if you’re using a time series, the interaction filter can work as a date range filter when you drag or ‘brush’ your mouse across it, which also works for line charts and area charts.
Here’s an example of interaction filters in action, as prepared by the GDS team:
<iframe width=”569″ height=”519″ src=”https://datastudio.google.com/embed/reporting/1aXb06M7b9SYjNG2qucvB7sasoaqLIRJL/page/0XHb” frameborder=”0″ style=”border:0″ allowfullscreen></iframe>
These interaction filters make it even simpler and more intuitive for you to filter data you wish to be displayed on your dashboard. You no longer have to enter values by hand—all it takes is a mouse click or drag to create a filter. From the end user’s standpoint, it’s also easier now to find and display the data that you want because of this.
While dashboards are by far the quickest and easiest way to display and share your data, you’re probably also working with stakeholders who might prefer to print out their reports. With GDS’ January update, you can now implement to your PDF reports viewer refinements such as filter controls and date ranges. Now, it’s even easier to print and share customised reports.
The beauty of GDS is how you can adapt it to a wide range of users and stakeholders. So if you want to share a more informative version of a report based on the viewer’s customisations, it’s now possible with GDS.
Here at Data Studio Templates, we definitely think it’s great that Google continues to step up their game with the latest GDS updates. They might look minor on paper, but we believe each will have a tremendous impact in terms of usability and in enabling people to tell richer and more in-depth stories with data.
How about you, what do you think of the newest features launched by the GDS team? Please share with us your thoughts by leaving a comment below!