Menu


So in this post I’ll show you how you can use the new Google Maps feature in Google Data Studio to take a closer look at your geographic Ecommerce data from Google Analytics.
Depending on your business, gaining a greater understanding of where your customers are geographically can help with promotions and advertising.
The first step is to add your Google Analytics data to Google Data Studio. In this example I’m going to use the Google Analytics Demo Account which shows data for the Google Merchandise Store.
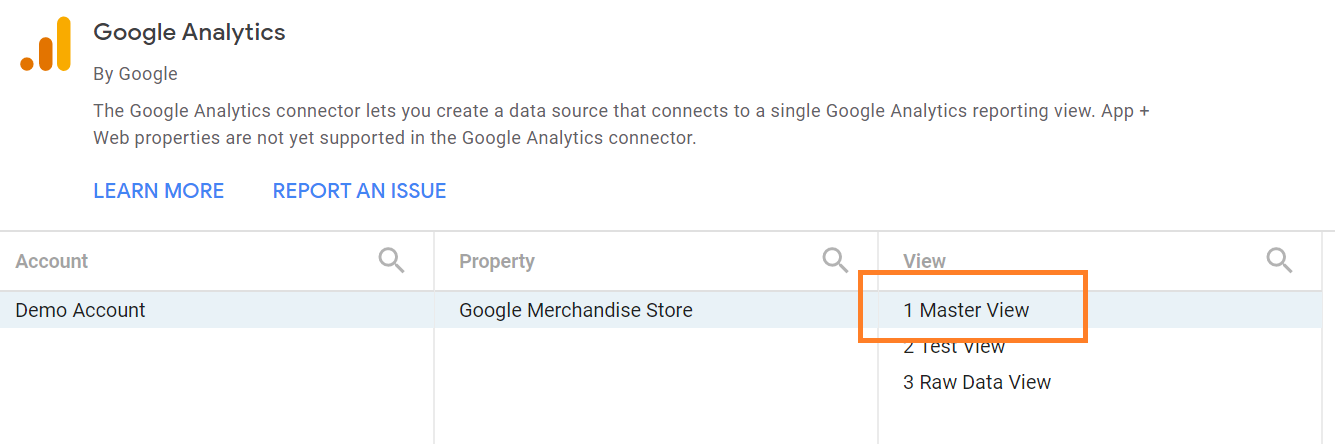
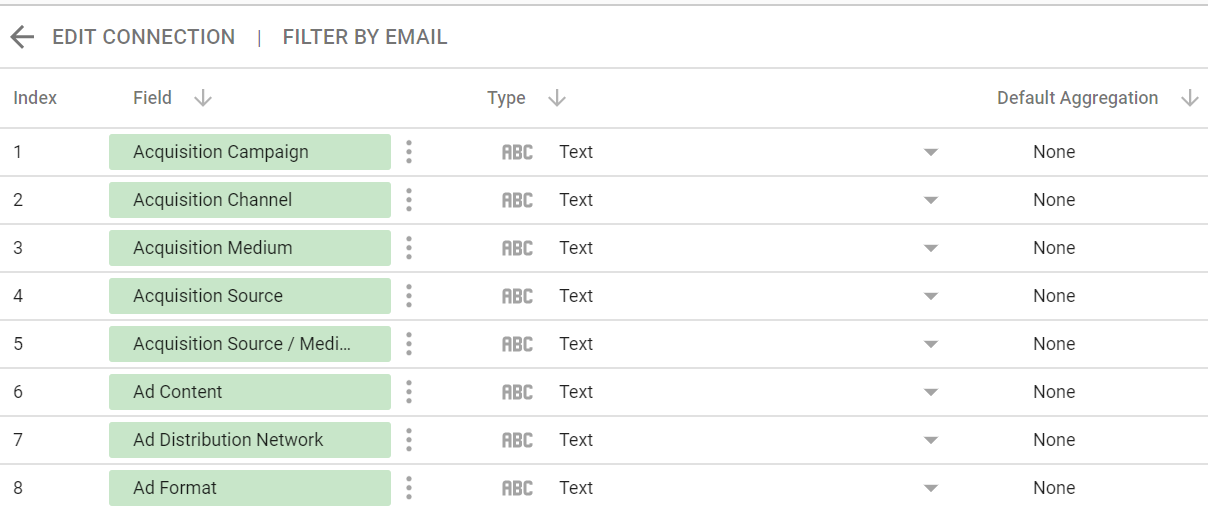
Once you’ve added the data you should see it in your view of the Data Source. We can now click ‘Finished’ to add it to the report.
At the time of writing, you can only add two metrics to your Google Map – one to determine the size of the Bubbles on the map and the other to determine the colour of the Bubble.
Unlike Geo Maps, where you can choose to display data as either bubbles or as a Cholorpeth AKA shaded area, you can currently only display geographic data points as Bubbles.
For this example we want to explore the Average Order Value and the number of Transactions by area.
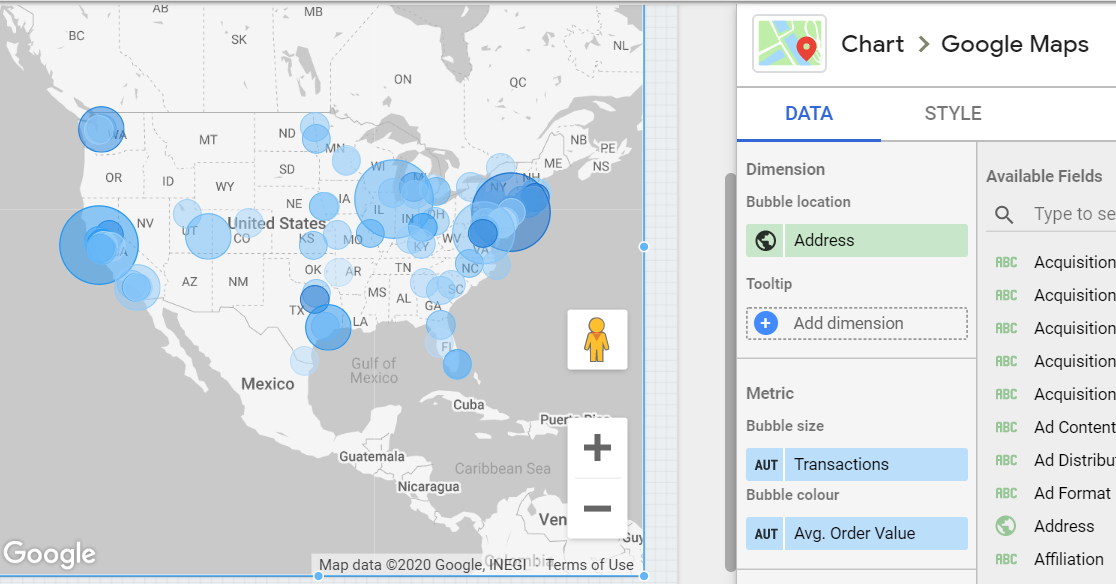
In the Screenshot below we see how to setup a Google Map to display the two different Google Analytics Ecommerce metrics.
For Bubble Size we have the number of Transactions and for Bubble Colour we have the Average Order Value.
This allows us to spot areas where they might not be many orders, but the average value is higher. This could indicate that a specific area might be worth targeting for high value items.
We can also incorporate other chart elements to enhance the usability of our Google Map.
For example this data set only includes data from the United States. We could therefore include a Geo Map showing Transactions and Avg. Order Value by State.
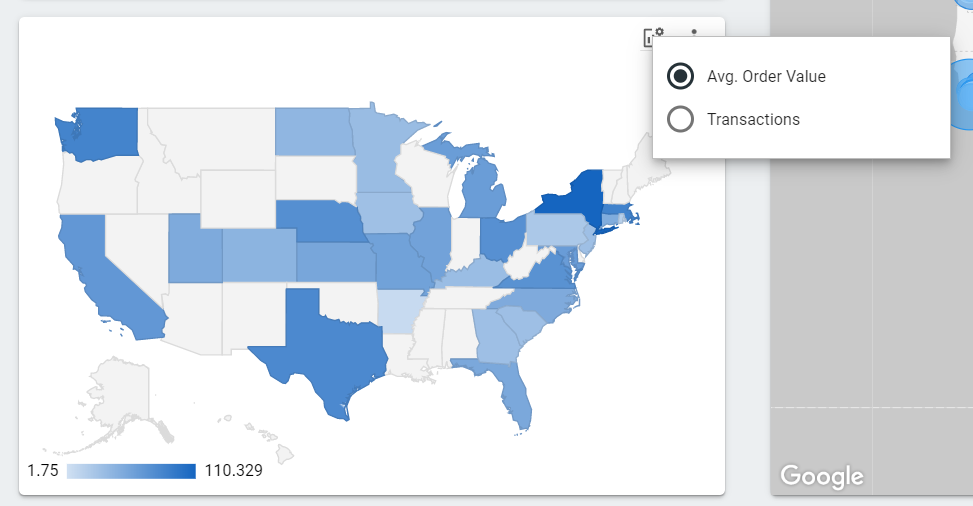
If we click on a specific state we the Google Map will automatically zoom in to show us the locations relevant to that selection.
In the example below I’ve clicked on Florida in the left hand geo map. The Google Map on the right adjusts the zoom to focus in on Florida. This is a quick way of navigating around a large area.
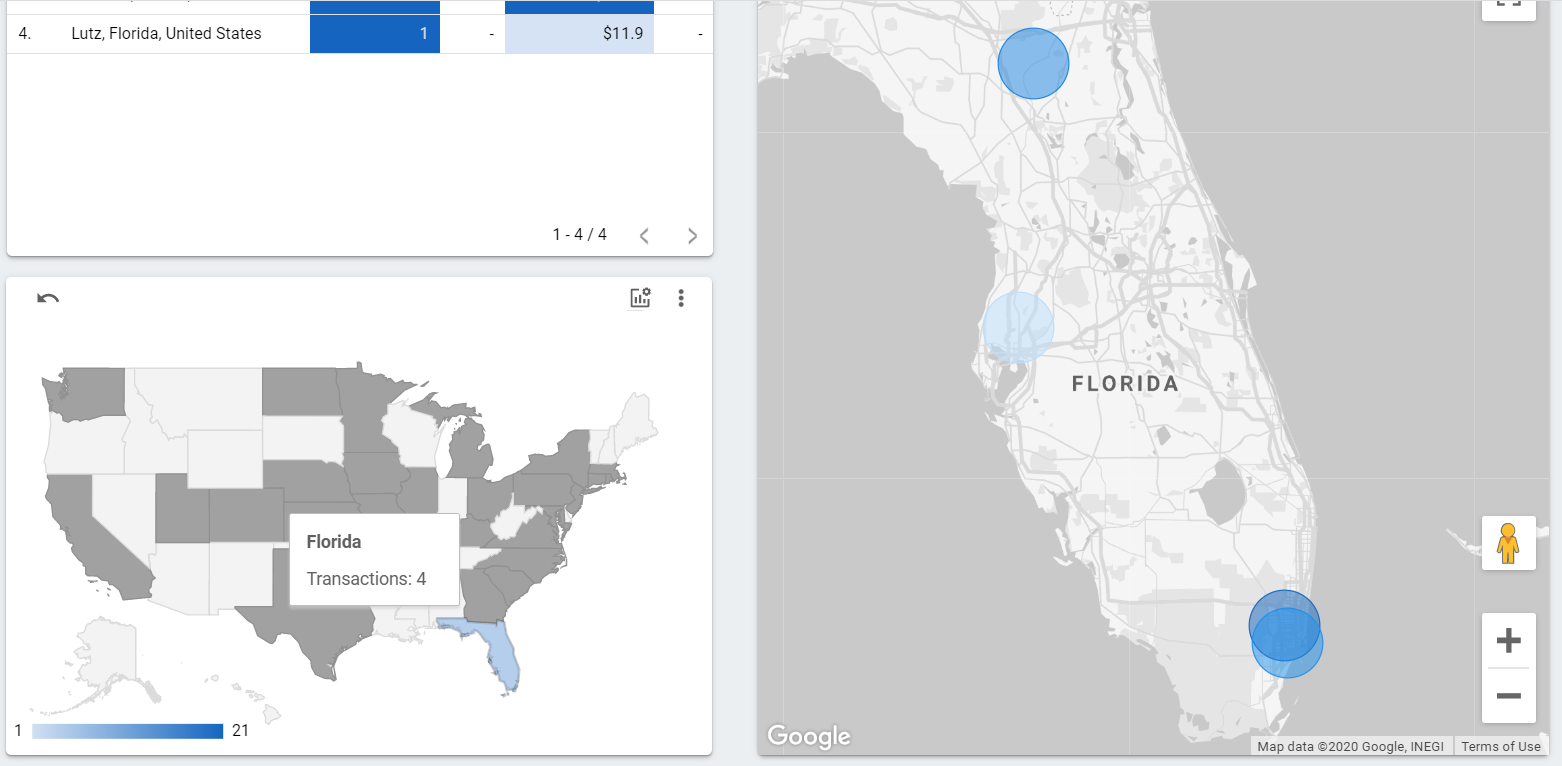
In addition I’ve also added a table showing the number of transactions and average order value by Location. It is listed as “Address” in the table.
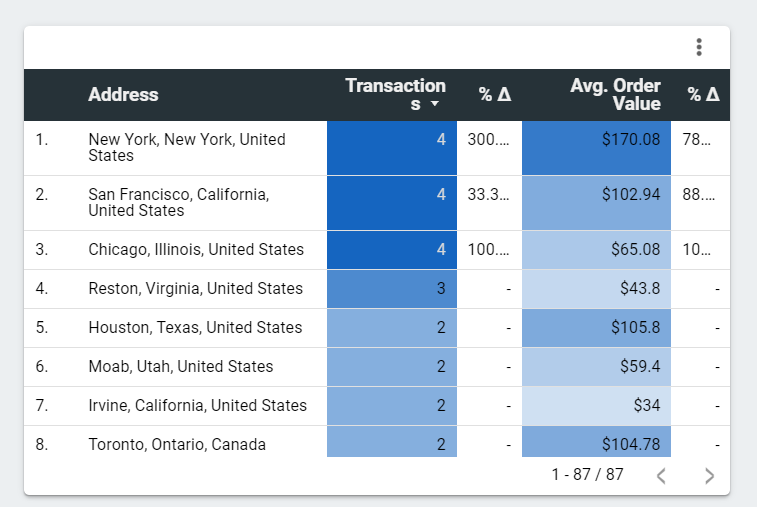
This allows us to take a look at specific locations within the data set.
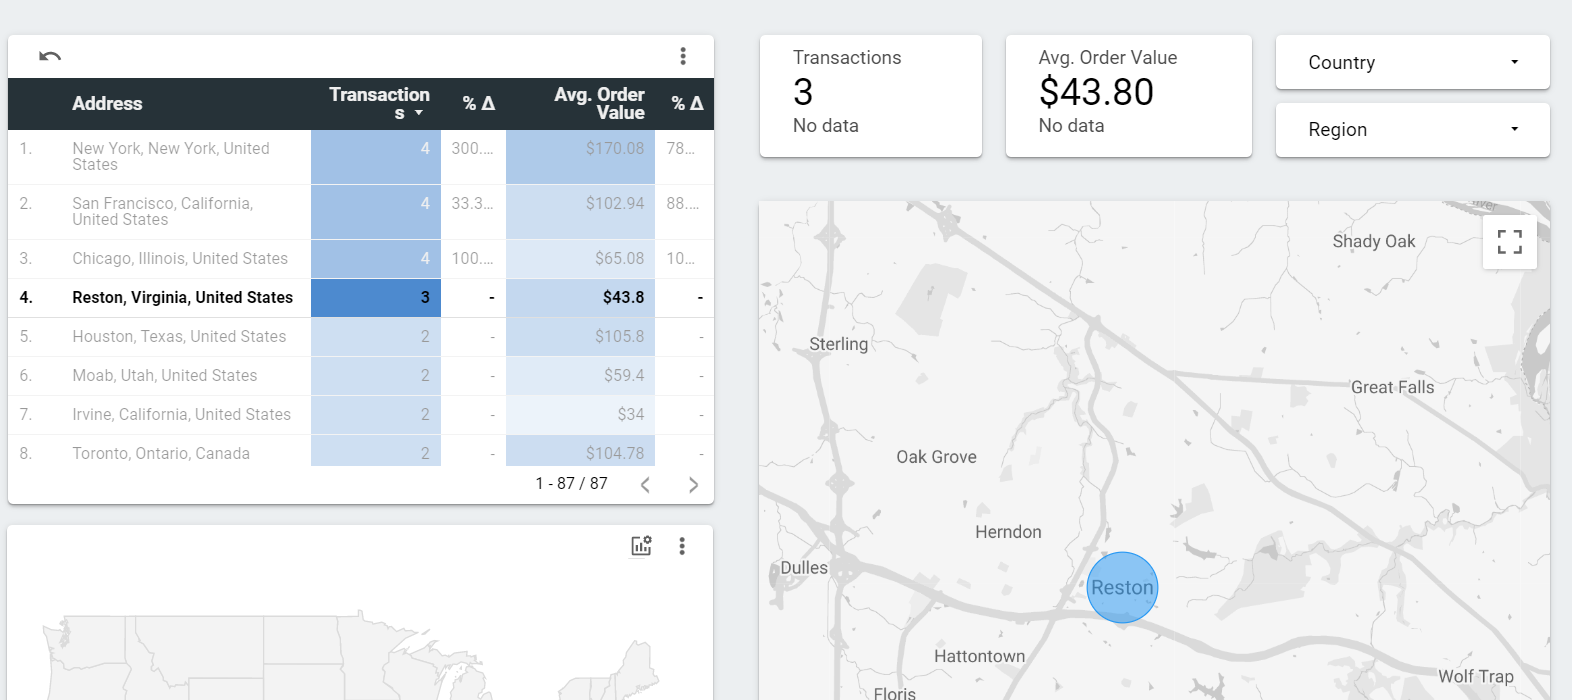
For example below I’ve decided to zoom in to Reston, Virginia.
Check out all our Ecommerce Data Studio reports and templates here.